The short answer
The latest official average mileage per year is 7,100 miles per car, for cars kept by households in England in 2025, according to the Department for Transport's National Travel Survey. Electric cars came out highest, at 9,400 miles, and petrol cars lowest, at 6,200. In 2002 the same survey put the average at 9,200 miles, so cars are driven less far each year than they were.
The survey covers England, not the whole UK, so treat its figures as a guide for Scotland, Wales and Northern Ireland. Below are the figures by year, by fuel and by the purpose of the trips, the reason per-driver figures look so different, a quick sum for any car's expected mileage, and how to find the real yearly mileage of the car you are looking at.
Average mileage per year UK: how has it changed?
The survey's car mileage comes from households themselves: they estimate how far each car they keep, including any company car, has travelled in the last year. The Department for Transport averages those estimates and rounds them to the nearest hundred. Its tables with the 2025 results were updated on 10 September 2026, and the next set is due in summer 2027.
| Year | Average miles per car, England |
|---|---|
| 2002 | 9,200 |
| 2005 | 9,000 |
| 2010 | 8,300 |
| 2015 | 8,000 |
| 2019 | 7,600 |
| 2021 | 5,400 |
| 2023 | 7,000 |
| 2025 | 7,100 |
Ignore 2021's 5,400 miles when you look for a trend: the survey's own notes say results for 2020 to 2022 were disturbed by the pandemic, both in how people travelled and in how the data could be collected. Outside those years the line slopes gently down, then levels off at 7,000 to 7,100 miles from 2023.
Which cars cover the most miles a year?
Split by fuel, the 2025 averages for cars in England were:
| Fuel | Average miles in 2025 |
|---|---|
| Battery electric | 9,400 |
| Hybrid (not plug-in) | 8,100 |
| Diesel | 8,000 |
| Petrol | 6,200 |
| All cars | 7,100 |
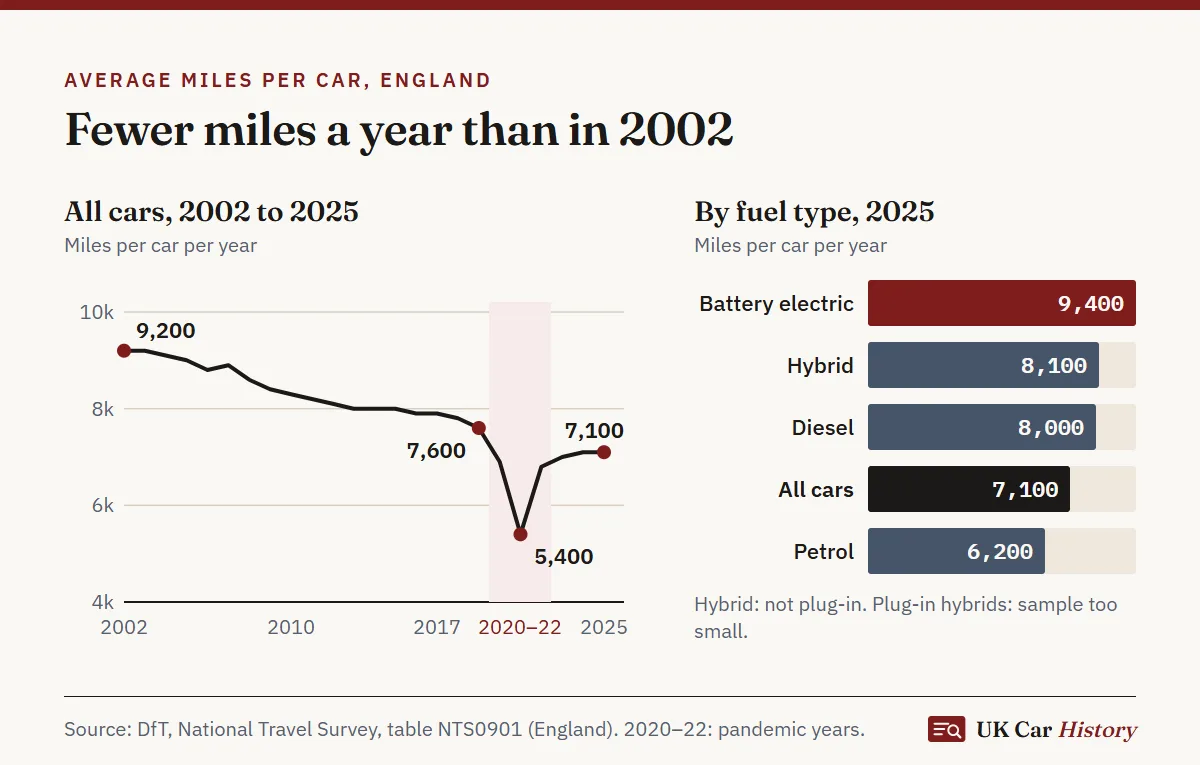
There is no 2025 figure for plug-in hybrids: the survey flags their sample as too small. Why electric cars top the table is not something the survey explains. What it does give a buyer is a fairer benchmark: judge an electric car against 9,400 miles a year and a petrol car against 6,200, rather than holding both to the overall 7,100.
Average miles per year UK driver: why do the figures disagree?
Many averages you will see online are much lower than 7,100. Usually that is because they divide the miles among people, not cars, and the people counted include children and anyone without a licence.
In 2025 the average person in England drove a car or van for 2,758 miles and rode in one as a passenger for 1,495. Their travel by every means added up to 5,605 miles, and 76% of it was by car.
Per-person numbers are collected through a diary that each respondent keeps for a week. In 2025 the diary went digital, and the Department for Transport links the switch to fewer trips being recorded for some purposes, car trips included, so set 2025 against earlier years with that in mind. Averages published by insurers or worked out from MOT data come from other samples altogether, so expect them to differ from the survey.
What are the miles used for?
The survey also asks how each car's mileage divides between kinds of trip. In 2025, an average car in England covered:
| Kind of trip | Miles per car, 2025 |
|---|---|
| Commuting | 2,200 |
| Business | 500 |
| Everything else (shopping, leisure, visits) | 4,500 |
The rounding of each line is why the total comes to 7,200 rather than 7,100. In 2019 a car's commuting share was 2,700 miles, and the 500-mile drop since then is the biggest change in the table. Only 4% of the cars in the 2025 sample were company cars.
Someone who drove to a distant office every day, or used the car for work, will have racked up far more than the average; a car kept for local errands will usually show less. The MOT readings tell you which description fits the car you are looking at.
How wide is the spread of yearly mileages?
An average hides cars at both ends. Adding up the survey's rounded shares for 2025 gives this rough picture:
| Miles in the year | Approximate share of cars, England 2025 |
|---|---|
| Under 2,000 | 8% |
| 2,000 to 4,999 | 23% |
| 5,000 to 8,999 | 40% |
| 9,000 to 11,999 | 16% |
| 12,000 or more | 13% |
Put another way, 31% of cars stayed under 5,000 miles and 13% passed 12,000. Being unusual is not the same as being wrong: the warning sign is a set of readings that contradict each other, not a total that sits far from the middle.
Average mileage per year UK calculator: work out the expected miles
Three steps give you a benchmark for any car:
- Work out how old the car is. The month of first registration is printed on the V5C and appears in the free details our look-up gives for any registration.
- Multiply those years by the national figure of 7,100 miles, or by its fuel's figure: 9,400 for battery electric, 8,000 for diesel, 6,200 for petrol.
- Hold the result up against the dashboard and the most recent MOT reading. A big gap either way is a prompt to look at the history, not a verdict.
| Age | At 7,100 miles a year | At the diesel average (8,000) |
|---|---|---|
| 4 years | 28,400 | 32,000 |
| 6 years | 42,600 | 48,000 |
| 9 years | 63,900 | 72,000 |
| 11 years | 78,100 | 88,000 |
| 14 years | 99,400 | 112,000 |
Bear in mind that average mileages were higher fifteen or twenty years ago, so an older car sitting above the line may simply reflect how cars were used then. Our mileage history check page explains how the car's own readings, and the verdict in our reports, show whether its mileage adds up.
What has this particular car really averaged?
A national average is a starting point; the car's own readings are the real evidence. Each MOT test logs the odometer, and you can see those logs online for tests since 2005 in England, Scotland and Wales and since 2017 in Northern Ireland. Because a car in Great Britain does not need its first MOT until it is three years old, the earliest reading already bundles together its first three years on the road.
Take an example. A car's first MOT, in 2019, recorded 24,600 miles, and its latest, in 2025, recorded 63,000. That is 38,400 miles in six years, or 6,400 a year: a little below the national average, and unremarkable.
The overall average can hide a lot, so read the readings one pair at a time. Similar jumps each year are what everyday use looks like. A near-standstill year, or any reading that goes backwards, is a question for the seller; the causes are covered in our guide to a mileage discrepancy on MOT history.
Our free look-up lists every MOT reading with its date and works out the car's average per year from them, using only the registration.
Should a low or high yearly mileage worry you?
Neither, on its own. In 2025, 8% of cars in England covered fewer than 2,000 miles and 13% covered 12,000 or more, so both ends are well populated. The question is whether the number fits the story. Look harder when:
- a new keeper seems to have driven far less than the old one, and there is no reason given;
- a polished steering wheel, worn pedal rubbers or a sagging driver's seat sit oddly with a low figure;
- nothing on paper, such as a service invoice or an old MOT certificate, confirms any earlier reading;
- a very high mileage comes with gaps in the servicing.
For what counts as a sensible mileage when you are buying, our guide to good mileage for a used car goes further.
Questions and answers
How many miles a year does the average UK driver do?
Measured per car, 7,100 miles in England in 2025. Measured per person, people in England travelled 2,758 miles a year as a car or van driver, but that figure is averaged over everyone, including people who do not drive.
Is 12,000 miles a year high?
Higher than most: the 2025 average was 7,100 miles per car. Even so, roughly one car in eight in England covered 12,000 miles or more that year.
What is the average yearly mileage of a diesel car?
In England in 2025, diesel cars averaged 8,000 miles, against 6,200 for petrol cars and 7,100 for all cars.
Why was average mileage so low in 2021?
The pandemic. The average dropped to 5,400 miles per car in 2021, and the survey notes that results for 2020 to 2022 were disturbed both by how people travelled and by how the data could be collected.
Do these figures cover the whole UK?
No. The National Travel Survey has covered England only since 2013, so its figures are a guide rather than a measurement for Scotland, Wales and Northern Ireland.
Sources
This guide is general information for people buying or owning a car in the UK, not legal or financial advice. UK Car History is an independent service, not affiliated with the DVLA, the DVSA or GOV.UK.