The short answer
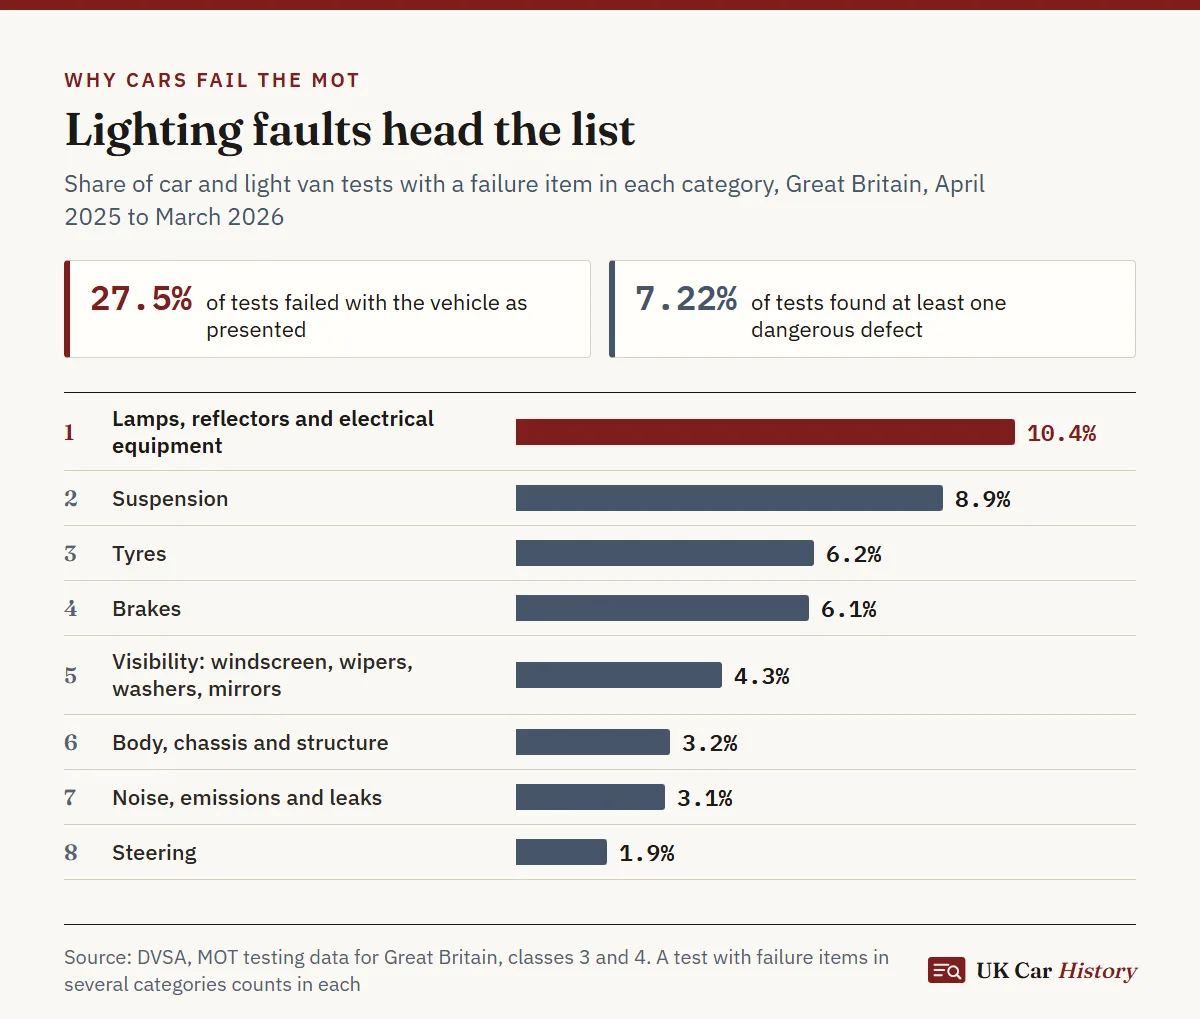
Roughly one car or light van in four fails its MOT as presented: 27.5% in DVSA's figures for April 2025 to March 2026. Top of the list of the most common MOT failures sits lighting (lamps, reflectors and electrical equipment), with a failure item on about one test in ten (10.4%). Suspension comes second, then tyres, brakes and visibility items such as wipers and the windscreen.
The figures here cover Great Britain. Below you will find how often cars fail and how often a defect is dangerous, the full ranking of fault categories, what each common fault involves, how age and model change the odds, and how to keep your own car off the list.
Which faults fail the most MOTs?
DVSA sorts every failure item, meaning a dangerous or major defect, by the part of the vehicle it concerns. A test with failure items in three areas is counted in all three, and a failed test carried 2.39 failure items on average in 2025 to 2026, so the percentages in the table sum to far more than the fail rate.
| Category | Tests with a failure item here | Share of all failure items |
|---|---|---|
| Lamps, reflectors and electrical equipment | 10.4% | 24.9% |
| Suspension | 8.9% | 20.5% |
| Tyres | 6.2% | 12.9% |
| Brakes | 6.1% | 15.2% |
| Visibility (windscreen, wipers, washers, mirrors) | 4.3% | 7.7% |
| Body, chassis and structure | 3.2% | 6.3% |
| Noise, emissions and leaks | 3.1% | 5.9% |
| Steering | 1.9% | 3.6% |
The two columns answer different questions. The first says how many cars a problem catches; the second says how much of the overall fail list it fills. Brakes catch slightly fewer tests than tyres yet make up more of the failure items, so a test that fails on brakes tends to list more than one brake fault.
What goes wrong in each of the top five areas?
Almost everything near the top of the list wears out, blows or rusts in ordinary use. The inspection manual sets out what the tester examines in each area; these are the faults that most often turn a pass into a fail:
- Lamps and electrics. This heading covers far more than bulbs: headlamp aim, brake lights, indicators, hazard warning lights, the rear number plate lamp, reflectors, wiring and the battery. One headlamp or indicator that does not work at all is enough for a major defect.
- Suspension. The springs and dampers, and everything that locates the wheels: arms, sub-frames, anti-roll bars and the bushes and joints between them. Wear and rust build up out of sight under the car, which makes a suspension advisory worth acting on before the next test.
- Tyres. Tread below the legal limit, a cut that reaches the cords, a lump or bulge from structural damage, or two different sizes on one axle. Tread that is too low is graded dangerous.
- Brakes. Pads worn to their wear indicator are a major defect, and pads under 1.5mm thick are dangerous. Discs that are badly worn or damaged, rusted brake pipes, damaged flexible hoses and a weak result in the brake efficiency test are failures too.
- Visibility. A chip or crack in the part of the screen the driver looks through, wipers or washers that cannot clear the glass, a missing or broken mirror, or anything else in the way of a clear view.
Does a car's age change its chance of failing?
Yes, up to a point. The Department for Transport's 2023 consultation on moving the first MOT drew on DVSA data, which showed failure rates rising sharply with age up to about 14 years and then reaching a plateau. Past 20 years, where few vehicles remain, the rate dropped back a little.
Even at the first test, failure is common: 14% of class 4 vehicles failed initially at three years old in 2019, and 16% at four.
With an older car, the testers' own notes are the best forecast: its advisories show which worn parts they have already spotted.
MOT fail rate by car: which popular models fail most?
You will not find an official fail rate per model from DVSA. What it does release is the raw material: an anonymised record of each MOT test since 2005, giving the make, model, mileage and any reasons for failure, which anyone may reuse under the Open Government Licence. We ran our own count on it for the 14 car models tested most often in October 2025.
Our count covers the 3,205,764 first tests of class 4 cars and light vans that month; retests are excluded. Any vehicle that failed, or that passed only once repairs had been made at the test centre, is counted as a first-time fail. Where a trim is recorded as if it were a model, such as Fiesta Titanium, it is added to its model, while different models that share part of a name, the Yaris Cross for example, are kept apart.
| Model | Failed first time | At 9 to 11 years | At 12 to 14 years | Tests, October 2025 |
|---|---|---|---|---|
| Renault Clio | 45.6% | 43.6% | 49.5% | 29,118 |
| Vauxhall Corsa | 38.0% | 36.9% | 42.5% | 80,279 |
| Ford Fiesta | 36.1% | 33.7% | 41.1% | 133,156 |
| Vauxhall Astra | 35.6% | 29.8% | 35.7% | 56,773 |
| Fiat 500 | 34.0% | 32.8% | 37.8% | 33,289 |
| Ford Focus | 33.9% | 26.9% | 38.5% | 85,177 |
| Volkswagen Polo | 33.8% | 27.4% | 38.2% | 60,781 |
| Nissan Qashqai | 32.7% | 30.7% | 46.1% | 58,477 |
| Toyota Yaris | 29.1% | 20.6% | 31.7% | 44,013 |
| Honda Jazz | 27.5% | 16.4% | 22.6% | 31,950 |
| Volkswagen Golf | 26.6% | 17.7% | 28.3% | 83,554 |
| Mercedes-Benz C-Class | 26.4% | 20.4% | 30.1% | 32,930 |
| Audi A3 | 25.2% | 18.2% | 28.9% | 40,251 |
| BMW 3 Series | 24.8% | 18.1% | 28.0% | 44,148 |
| All cars and light vans | 28.6% | 26.6% | 34.9% | 3,205,764 |
Age explains part of the spread. A model with an older population on the road will fail more often than one with mostly young cars, so compare the two age columns for a like-for-like view. One month is a small window, so a gap of a point or two between models means little.
None of this outweighs the record of the actual car in front of you. Plenty of cars beat their model's average, and plenty fall short of it.
What can you check before the test to avoid these fails?
The categories at the top of the list are also the easiest to check on your own drive a few days before the test:
- Lamps: ask someone to watch while you work through every light, brake lights and number plate lamp included, and replace any bulb that has gone.
- Tyres: use a gauge or a coin in the grooves at several points around each tyre, inner edge to outer, and look along both sidewalls for cuts or bulges.
- Brakes: notice warning lights, grinding or squealing, or a pull to one side when you brake, and have the pads looked at if the last MOT called them thin.
- Suspension: listen for knocks over speed bumps, look for tyres wearing unevenly, and have any suspension advisory from the last test inspected.
- View: fill the washer bottle, test the wipers with the jets on, and book a repair for any chip in front of the driver.
Our MOT checklist has a longer list, including the problems that can make a centre refuse to start the test.
Time left on the old certificate does not help once a dangerous defect is found: the car stays off the road until that defect has been repaired.
Where can you read a car's own failure history?
Fails do not disappear when the car is repaired: the history keeps each one, with its failure items, beside the retest that came after. Type the registration into the free look-up on this page for every test with its result, failure items, advisories and mileage, plus the safety recall status the DVSA reports.
When you read them, a few patterns matter:
- A fail, then a pass a few days later: normally a repair and a retest, which is the system working as intended.
- The same area failing at test after test: a part that wears quickly on this car, or a repair that never quite worked.
- A dangerous defect: ask who fixed it, and ask to see the bill.
- Advisories on the newest pass: the likeliest candidates for the next fail, and a fair point to raise on price.
Mileage readings, gaps between tests and the other parts of the record are covered in what to look for in MOT history.
Questions and answers
What share of cars pass the MOT first time?
Just under three in four: 72.5% of car and light van tests in Great Britain passed without any repair during the test in 2025 to 2026. Counting cars that passed after faults were fixed during the test, it was 77.7%.
Which defects are most often graded dangerous?
Tyres, by a wide margin. They accounted for 60.6% of the dangerous defects found in 2025 to 2026, and brakes for another 28.8%.
Do advisories count in the failure figures?
No. Only dangerous and major defects are failure items. Minor defects and advisories appear on a pass and are left out of the failure counts.
Can one faulty bulb fail a car?
Yes, if it leaves a headlamp or an indicator not working, because that is a major defect. Checking every lamp before the test is the cheapest way to avoid this fail.
Are these MOT figures official statistics?
No. DVSA publishes its MOT testing data for Great Britain every quarter, but it says the data is not classed as an official statistic.
Why do two cars of the same model and age differ so much?
Because averages hide how each car was used and looked after. A model's fail rate describes thousands of cars; the MOT history of the one you are viewing describes that car alone.
Sources
- GOV.UK (DVSA): MOT testing data for Great Britain
- GOV.UK (DfT): Changes to the date of the first MOT test, consultation (failure rates by age)
- DVSA open data: anonymised MOT tests and results
- GOV.UK (DVSA): MOT inspection manual for cars and passenger vehicles
- GOV.UK: Getting an MOT (results, and driving after a fail)
This guide is general information for people buying or owning a car in the UK, not legal or financial advice. UK Car History is an independent service, not affiliated with the DVLA, the DVSA or GOV.UK.